MANAGEMENT REPORT
BUSINESS ENVIRONMENT REVIEW
The main macroeconomic factors affecting the financial position of the Company include the dynamics of oil prices, inflation rates, fluctuations in exchange rates, in particular, the KZT-to-USD exchange rate.
| 2016 | 2017 | 2018 | Variance | |
|---|---|---|---|---|
| Average dated Brent price (DTD) | 43,73 | 54,19 | 71,31 | 32% |
| Inflation rate – Kazakhstan (%) | 8,50% | 7,10% | 5,3% | –2.1 bp |
| Average exchange rate (KZT to USD) | 342,16 | 326,00 | 344,85 | 6% |
OPERATING RESULTS
| Company |
2016 (Actual) |
2017 (Actual) |
2018 (Plan) |
2018 (Actual) |
2018 (Var.) |
2018 (Plan) |
|---|---|---|---|---|---|---|
| Embamunaigas JSC Including at OGPO of: |
2 832,008 | 2 840,015 | 2 895,000 | 2 895,332 | 0,332 | 2 895,000 |
| Zhaiykmunaigas | 954,171 | 953,679 | 944,063 | 944,153 | 0,090 | 935,142 |
| Zhylyoimunaigas | 989,14 | 1034,925 | 1109,707 | 1109,859 | 0,152 | 1123,595 |
| Dossormunaigas | 404,283 | 371,531 | 366,430 | 366,473 | 0,043 | 362,224 |
| Kainarmunaigas | 484,414 | 479,880 | 474,800 | 474,847 | 0,047 | 474,039 |
| Indicators |
2016 (Actual) |
2017 (Actual) |
2018 (Plan) |
2018 (Actual) |
2018 (Var.) |
|---|---|---|---|---|---|
| Production | 191,649 | 199,756 | 219,845 | 221,228 | 1,4 |
CAPITAL EXPENDITURES
| Investment items | 2014 | 2015 | 2016 | 2017 | 2018 |
|---|---|---|---|---|---|
| Construction operations | 12 333 | 10 685 | 30 989 | 12 618 | 13 920 |
| FA and IA purchase | 4 556 | 5 564 | 3 536 | 8 375 | 12 175 |
| Production drilling | 13 279 | 9 213 | 8 253 | 8 632 | 9 306 |
| Prospecting and exploration drilling | 3 225 | 2 163 | 4 620 | 8 118 | 8 158 |
| Other | 15 606 | 549 | 1 271 | 304 | 641 |
| Total САРЕХ | 48 999 | 28 174 | 48 669 | 38 047 | 44 201 |
INNOVATIONS
In order to implement the tasks set in the strategy, a wide range of technological innovations has been introduced. The Company develops and supports advanced solutions that ensure higher efficiency and transparency of the business due to improved employee performance and reduced costs.
Smart Field
In 2016, Embamunaigas JSC implemented a pilot project Smart Field at the Uaz Field. The technical solution was developed by the Company’s employees together with domestic IT and new technologies experts. As a result, the field operates in a digital development mode. Having achieved positive results at the Uaz Field, it was decided to replicate the system to other fields, which was in progress in 2017–2018 and will continue until 2023.
The Smart Field is an automated system designed to control the oil and gas field, which allows achieving its maximum performance by integrating disparate systems into a single information system. The main goal of introducing the concept of a smart field is to improve the process of management decision-making support in relation to mature assets, determining the feasibility of extra costs to extend the depletion period and reduce risks.
Combining various sensors, mobile devices, etc. into a single system makes it possible to analyze the data acquired and control the system from a single operational center and respond almost instantly to changing system parameters. The benefits of implementation include reduced operating costs for equipment operation, increased operating rate of the existing well stock, saving energy, reduced downtime of wells, optimizing the development mode of a field, minimizing risks to health, environment and safety, etc.
The technologies for the development of smart fields do not stand still and constant work is required to update the project. In this connection, in 2018, Embamunaigas JSC established a working group that studies new technologies and solutions implemented by international oil and gas companies in order to expand the existing project Smart Field.
PROCUREMENT ACTIVITIES
| Description | Amount | Performance % | |
|---|---|---|---|
| Total procurement plan for 2018 | 89 898,58 | 100 | |
| including | |||
| Goods | 11 984,46 | 13,3 | |
| Works | 51 890,56 | 57,7 | |
| Services | 26 023,56 | 28,9 | |
| Total procurement with suppliers assigned | 89 895,82 | 100 | LC share |
| including | |||
| Goods | 11 981,70 | 99,98 | 42,0 |
| Works | 51 890,56 | 100,0 | 94,0 |
| Services | 26 023,56 | 100,0 | 94,0 |
| Savings under the contracts | 7 116,00 | 8 | |
| including | |||
| Goods | 1 461,00 | 12,2 | |
| Works | 2 444,00 | 4,7 | |
| Services | 3 211,00 | 12,3 |
FINANCIAL REVIEW
|
2014 (Actual) |
2015 (Actual) |
2016 (Plan) |
2017 (Actual) |
2018 (Plan) |
2018 (Actual) |
2018 (Var.) |
2018 % |
|
|---|---|---|---|---|---|---|---|---|
| Oil production, thous. tonnes | 2 823 | 2 823 | 2 832 | 2 840 | 2 895 | 2 895 | 0 | 0 |
| Receipts (income) | 344 675 | 198 113 | 243 517 | 309 747 | 332 627 | 433 436 | 100 809 | 30 |
| Cost of sales | –119 229 | –94 991 | –95 772 | –121 290 | –134 703 | –137 184 | –2 481 | 2 |
| Gross income | 225 446 | 103 121 | 147 745 | 188 457 | 197 924 | 296 252 | 98 328 | 50 |
|
General and administrative expenses |
–15 738 | –24 542 | 58 | –9 896 | –12 934 | –47 840 | –34 906 | 270 |
| Transport and selling costs | –135 071 | –75 869 | –70 366 | –102 991 | –119 674 | –155 497 | –35 823 | 30 |
| Operating income (loss) | 74 638 | 2 711 | 77 437 | 75 570 | 65 315 | 92 915 | 27 600 | 42 |
|
Financial income /(expenses), net |
–2 714 | 303 | 312 | 461 | –2 650 | –1 176 | 1 474 | -56 |
| Other profit /(loss) net | 20 538 | 62 905 | –586 | –482 | 0 | 21 216 | 21 216 | 0 |
| Profit/(loss) before tax | 92 462 | 65 919 | 77 164 | 75 548 | 62 665 | 112 955 | 50 290 | 80 |
| Corporate income tax payable | –20 225 | –20 457 | –15 803 | –19 425 | –15 847 | –29 566 | –13 720 | 87 |
| Annual profit | 72 237 | 45 462 | 61 360 | 56 123 | 56 123 | 83 389 | 36 570 | 78 |
| 2014 | 2015 | 2016 | 2017 | 2018 | |
|---|---|---|---|---|---|
| Oil export sales | |||||
| КТО | |||||
| Sales, mln KZT | 236 809 | 118 432 | 126 832 | 187 983 | 262 216 |
| Volume, thous. tonnes | 1 920 | 1 571 | 1 226 | 1 526 | 1 546 |
| Average selling price, thous. KZT/tonne | 123 | 75 | 103 | 123 | 170 |
| CPC | |||||
| Sales, mln KZT | 106 152 | 60 767 | 92 944 | 101 250 | 143 444 |
| Volume, thous. tonnes | 816 | 766 | 860 | 792 | 811 |
| Average selling price, thous. KZT/tonne | 130 | 79 | 108 | 128 | 177 |
| Total oil exports, mln KZT | 342 961 | 179 199 | 219 777 | 289 233 | 405 660 |
| Total oil exports, thous. tonnes | 2 737 | 2 338 | 2 085 | 2 318 | 2 357 |
| Domestic oil sales | |||||
| POCR | |||||
| Sales, mln KZT | - | 7 783 | 18 549 | 13 583 | 24 234 |
| Volume, thous. tonnes | - | 210 | 609 | 358 | 459 |
| Average selling price, thous. KZT/tonne | - | 37 | 30 | 38 | 53 |
| AR | |||||
| Sales, mln KZT | - | 9805 | 3732 | 4602 | 1864 |
| Volume, thous. tonnes | - | 265 | 117 | 121 | 33 |
| Average selling price, thous. KZT/tonne | - | 37 | 32 | 38 | 56 |
| Crude oil | |||||
| Sales, mln KZT | 12 | 6 | 9 | 6 | 3 |
| Volume, thous. tonnes | 0,26 | 0,10 | 0,16 | 0,10 | 0,05 |
| Average selling price, thous. KZT/tonne | 47 | 58 | 58 | 62 | 53 |
| Total domestic sales, mln KZT | 12 | 17 594 | 22 290 | 18 191 | 26 101 |
| Total domestic sales, thous. tonnes | 0 | 475 | 726 | 479 | 492 |
| Total sales, mln KZT | 342 973 | 196 793 | 242 067 | 307 424 | 431 761 |
| Total sales, thous. tonnes | 2 737 | 2 813 | 2 811 | 2 797 | 2 849 |
| 2018 | 2017 | Var., % | |
|---|---|---|---|
| Staff remuneration | 48 321 | 45 474 | 6 |
| Mineral tax | 38 383 | 27544 | 39 |
| Depreciation, depletion and amortization | 19584 | 16987 | 15 |
| Maintenance and repair | 14308 | 10622 | 35 |
| Taxes, other than income tax | 4519 | 2073 | 118 |
| Materials and stock | 3727 | 3393 | 10 |
| Power consumption | 2992 | 2705 | 11 |
| Transportation costs | 2723 | 1810 | 50 |
| Changes in provision for environmental liability | -109 | 6270 | -102 |
|
Reduced liabilities for asset retirement exceeding total capitalized asset |
-821 | -778 | 6 |
| Other | 5899 | 5858 | 1 |
| 139 525 | 121 959 | 14 | |
| Changes in oil residue | (2341) | (670) | 250 |
| Total cost | 137 184 | 121 290 | 13 |
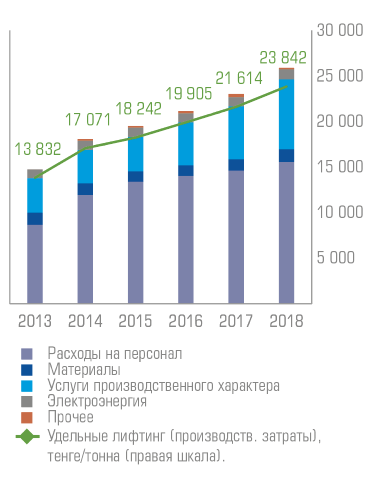
Lifting Costs, mln KZT
Specific lifting (the ratio of operating costs to production) in 2018 amounted to 23,800 KZT per tonne and increased by 10 % vs. 2017.
The major volume of operating expenses (52 %) is staff remuneration and expenses. About 30 % of expenses in 2018 fell on production services, 5 % on materials, 4 % on power.
The unit cost of a tonne of oil in 2018 was 47,400 KZT, which is 11 % higher than in 2017.
| Selling costs, mln KZT | 2018 | 2017 |
|---|---|---|
| Rent tax | 63 900,1 | 32 583,6 |
| Export customs duty | 53 889,7 | 36 585,8 |
| Transportation costs | 37 489,2 | 33 607,7 |
| Selling fees | 218,0 | 214,4 |
| 155 497,0 | 102 991,4 | |
| General and administrative expenses, mln KZT | ||
| Fines and penalties | 35 456,9 | 47,2 |
| Staff remuneration | 4 900,3 | 4 017,9 |
| Depreciation, depletion and amortization | 2 150,4 | 3 047,6 |
| Maintenance and repair | 485,3 | 432,0 |
| Transportation costs | 445,1 | 299,4 |
| Taxes, other than income tax | 292,1 | 207,6 |
| Sponsorship | 207,0 | 323,9 |
| Consulting and auditing fees | 130,6 | 105,7 |
| Reversal/accrual of provision for accounts receivable | 33,3 | –144,3 |
| Other | 997,1 | 2 803,3 |
| 45 098,2 | 11 140,2 | |
| 2018 | 2017 | Var.,% | |
|---|---|---|---|
| Rent tax | 63 900 | 32 584 | 96 |
| Export customs duty | 53 890 | 36 586 | 47 |
| Mineral tax | 38 383 | 27 544 | 39 |
| Social tax | 3 091 | 3 246 | -5 |
| Pollution tax | 1 969 | 708 | 178 |
| Property tax | 1 785 | 1 510 | 18 |
| Other taxes | 1 057 | 201 | 425 |
| Total taxes other than CIT | 164 074 | 102 379 | 60 |
| Profit before tax | 112 955 | 75 548 | 50 |
| Income tax expenses | 29 566 | 19 425 | 52 |
| Effective tax rate | 26 % | 26 % | 0 |
|
As of December 31, 2018 |
As of December 31 2017 |
|
|---|---|---|
| Assets | ||
| Long-term assets | ||
| Fixed assets | 187.656.191 | 173.028.945 |
| Intangible assets | 20.686.194 | 15.045.692 |
| Other financial assets | 38.005.431 | 32.258.446 |
| Deferred tax assets | 10.380.026 | 10.415.904 |
| Advances paid for long-term assets | 2.154.102 | 1.670.720 |
| Total long-term assets | 258.881.944 | 232.419.707 |
| Current assets | ||
| Inventory | 10.944.113 | 7.272.093 |
| Prepaid income tax | 3.968.337 | 772.876 |
| Prepaid taxes and VAT receivable | 15.899.345 | 12.244.843 |
| Advances paid and deferred expenses | 3.507.440 | 2.819.251 |
| Trade and other accounts receivable | 30.838.853 | 35.948.751 |
| Other financial assets | - | 31.884.021 |
| Cash and cash equivalents | 111.445.891 | 73.423.065 |
| Total current assets | 176.603.979 | 164.364.900 |
| Total assets | 435.485.923 | 396.784.607 |
| Capital | ||
| Authorized capital stock | 162.399.820 | 162.399.820 |
| Retained earnings | 153.032.636 | 157.246.242 |
| Total capital | 315.432.456 | 319.646.062 |
| Liabilities | ||
| Long-term liabilities | ||
| Historical liabilities | 5.806.806 | 1.807.468 |
| Provisions | 24.151.252 | 23.530.091 |
| Total long-term liabilities | 29.958.058 | 25.337.559 |
| Current liabilities | ||
| Historical liabilities | 1.573.568 | 2.623.489 |
| Provisions | 36.329.095 | 8.413.484 |
| Mineral tax and rent tax payable | 23.287.080 | 17.947.342 |
| Trade and other accounts payable | 28.905.666 | 22.816.671 |
| Total current liabilities | 90.095.409 | 51.800.986 |
| Total liabilities | 120.053.467 | 77.138.545 |
| Total liabilities and capital | 435.485.923 | 396.784.607 |